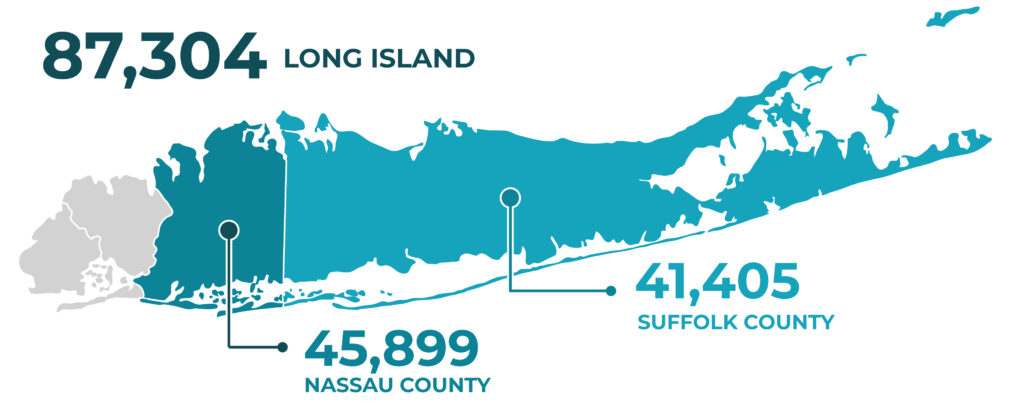
EV Registrations Map
Join the Growing EV Movement on Long Island
Thousands of Long Islanders are already driving electric—and the numbers keep climbing. Explore how EV ownership is spreading across neighborhoods and towns. As more residents make the switch, we’re building momentum toward a cleaner, more affordable transportation future for everyone.
Data as of 1/5/26
The latest LI EV registration
| ZIP Code | Community | EVs on the Road 1-05-26 | EVs On the Road Growth Over 3 Mo | Population | EVs per 1K population |
|---|---|---|---|---|---|
| 11746 | Huntington Station | 2,824 | 5.0% | 69,040 | 41 |
| 11791 | Syosset | 2,161 | 6.7% | 25,194 | 86 |
| 11743 | Huntington | 1,991 | 5.5% | 41,522 | 48 |
| 11040 | New Hyde Park | 1,934 | 5.5% | 42,344 | 46 |
| 11803 | Plainview | 1,830 | 7.3% | 30,219 | 61 |
| 11050 | Port Washington | 1,483 | 5.0% | 32,627 | 45 |
| 11801 | Hicksville | 1,441 | 5.2% | 41,792 | 34 |
| 11030 | Manhasset | 1,335 | 4.7% | 17,703 | 75 |
| 11758 | Massapequa | 1,310 | 4.1% | 54,741 | 24 |
| 11566 | Merrick | 1,293 | 5.5% | 35,172 | 37 |
| 11590 | Westbury | 1,290 | 4.9% | 48,243 | 27 |
| 11747 | Melville | 1,268 | 5.3% | 20,133 | 63 |
| 11576 | Roslyn | 1,255 | 3.3% | 12,796 | 98 |
| 11787 | Smithtown | 1,202 | 3.5% | 35,361 | 34 |
| 11725 | Commack | 1,166 | 8.0% | 28,838 | 40 |
| 11753 | Jericho | 1,158 | 2.4% | 12,729 | 91 |
| 11756 | Levittown | 1,130 | 6.9% | 42,553 | 27 |
| 11554 | East Meadow | 1,078 | 4.5% | 35,806 | 30 |
| 11021 | Great Neck | 1,037 | 7.8% | 19,474 | 53 |
| 11530 | Garden City | 1,013 | 5.9% | 28,041 | 36 |
| 11577 | Roslyn Heights | 997 | 6.1% | 12,771 | 78 |
| 11580 | Valley Stream | 982 | 6.5% | 42,644 | 23 |
| 11779 | Lake Ronkonkoma | 982 | 4.2% | 38,250 | 26 |
| 11733 | East Setauket | 963 | 4.9% | 17,967 | 54 |
| 11710 | Bellmore | 957 | 1.4% | 34,459 | 28 |
| 11768 | Northport | 939 | 5.5% | 21,433 | 44 |
| 11937 | East Hampton | 936 | 4.3% | 19,968 | 47 |
| 11706 | Bay Shore | 916 | 7.0% | 66,263 | 14 |
| 11598 | Woodmere | 894 | 7.1% | 14,316 | 62 |
| 11731 | East Northport | 862 | 5.6% | 30,353 | 28 |
| 11545 | Glen Head | 840 | 5.5% | 11,963 | 70 |
| 11797 | Woodbury | 827 | 6.0% | 9,338 | 89 |
| 11024 | Great Neck | 821 | 5.0% | 8,821 | 93 |
| 11772 | Patchogue | 818 | 2.8% | 44,459 | 18 |
| 11720 | Centereach | 797 | 3.4% | 28,623 | 28 |
| 11735 | Farmingdale | 788 | 5.2% | 32,778 | 24 |
| 11023 | Great Neck | 788 | 4.8% | 9,824 | 80 |
| 11581 | Valley Stream | 765 | 2.0% | 22,652 | 34 |
| 11757 | Lindenhurst | 752 | 5.5% | 45,157 | 17 |
| 11572 | Oceanside | 751 | 3.2% | 30,627 | 25 |
| 11570 | Rockville Centre | 731 | 5.2% | 28,162 | 26 |
| 11793 | Wantagh | 721 | 4.5% | 31,497 | 23 |
| 11510 | Baldwin | 706 | 4.9% | 34,814 | 20 |
| 11729 | Deer Park | 685 | 7.4% | 28,569 | 24 |
| 11727 | Coram | 680 | 5.3% | 29,716 | 23 |
| 11780 | Saint James | 678 | 5.1% | 15,508 | 44 |
| 11542 | Glen Cove | 672 | 8.6% | 29,020 | 23 |
| 11763 | Medford | 668 | 3.4% | 29,055 | 23 |
| 11520 | Freeport | 656 | 2.3% | 44,873 | 15 |
| 11741 | Holbrook | 644 | 5.7% | 27,046 | 24 |
| 11003 | Elmont | 635 | 7.6% | 44,716 | 14 |
| 11001 | Floral Park | 634 | 4.8% | 25,714 | 25 |
| 11714 | Bethpage | 633 | 9.3% | 22,475 | 28 |
| 11561 | Lido Beach | 625 | 1.8% | 38,847 | 16 |
| 11776 | Port Jefferson Station | 614 | 6.0% | 24,205 | 25 |
| 11704 | West Babylon | 612 | 5.9% | 40,367 | 15 |
| 11968 | Southampton | 608 | 2.0% | 14,467 | 42 |
| 11788 | Hauppauge | 585 | 1.6% | 16,273 | 36 |
| 11790 | Stony Brook | 580 | 6.8% | 21,519 | 27 |
| 11552 | West Hempstead | 570 | 11.5% | 26,053 | 22 |
| 11784 | Selden | 570 | 6.5% | 24,794 | 23 |
| 11767 | Nesconset | 567 | 6.8% | 14,379 | 39 |
| 11795 | West Islip | 560 | 6.7% | 25,244 | 22 |
| 11010 | Franklin Square | 535 | 7.0% | 25,618 | 21 |
| 11766 | Mount Sinai | 534 | 3.1% | 11,888 | 45 |
| 11771 | Oyster Bay | 532 | 6.0% | 10,173 | 52 |
| 11754 | Kings Park | 527 | 6.5% | 18,472 | 29 |
| 11501 | Mineola | 488 | 4.9% | 21,590 | 23 |
| 11764 | Miller Place | 487 | 5.2% | 12,566 | 39 |
| 11559 | Lawrence | 481 | 6.9% | 9,130 | 53 |
| 11967 | Shirley | 479 | 2.1% | 26,213 | 18 |
| 11762 | Massepequa Park | 475 | 7.2% | 22,447 | 21 |
| 11550 | Hempstead | 460 | 7.7% | 60,658 | 8 |
| 11777 | Port Jefferson | 459 | 2.7% | 9,346 | 49 |
| 11963 | Sag Harbor | 457 | 5.1% | 8,384 | 55 |
| 11020 | Great Neck | 456 | 7.3% | 5,986 | 76 |
| 11949 | Manorville | 452 | 4.4% | 14,663 | 31 |
| 11507 | Albertson | 452 | 4.1% | 6,561 | 69 |
| 11783 | Seaford | 443 | 5.7% | 21,588 | 21 |
| 11901 | Riverhead | 438 | 4.3% | 30,936 | 14 |
| 11738 | Farmingville | 432 | 3.8% | 16,732 | 26 |
| 11557 | Hewlett | 425 | 6.8% | 8,503 | 50 |
| 11701 | Amityville | 417 | 1.7% | 27,831 | 15 |
| 11717 | Brentwood | 415 | 5.3% | 62,193 | 7 |
| 11755 | Lake Grove | 407 | 5.7% | 12,118 | 34 |
| 11563 | Lynbrook | 406 | 6.0% | 22,558 | 18 |
| 11568 | Old Westbury | 403 | 6.6% | 4,198 | 96 |
| 11782 | Sayville | 394 | 5.6% | 15,682 | 25 |
| 11596 | Williston Park | 389 | 6.6% | 10,378 | 37 |
| 11722 | Central Islip | 382 | 7.3% | 37,491 | 10 |
| 11946 | Hampton Bays | 377 | 2.4% | 15,535 | 24 |
| 11742 | Holtsville | 372 | 3.6% | 12,699 | 29 |
| 11792 | Wading River | 367 | 3.4% | 8,528 | 43 |
| 11516 | Cedarhurst | 356 | 8.5% | 8,733 | 41 |
| 11702 | Babylon | 336 | 2.4% | 14,580 | 23 |
| 11730 | East Islip | 332 | 4.7% | 14,523 | 23 |
| 11778 | Rocky Point | 319 | 2.2% | 12,449 | 26 |
| 11740 | Greenlawn | 319 | 5.6% | 9,593 | 33 |
| 11703 | North Babylon | 314 | 2.6% | 16,635 | 19 |
| 11721 | Centerport | 301 | 3.8% | 6,318 | 48 |
| 11804 | Old Bethpage | 296 | 5.3% | 4,613 | 64 |
| 11560 | Locust Valley | 295 | 7.3% | 6,951 | 42 |
| 11716 | Bohemia | 286 | 10.0% | 10,315 | 28 |
| 11953 | Middle Island | 273 | -0.7% | 13,249 | 21 |
| 11980 | Yaphank | 272 | 1.9% | 4,931 | 55 |
| 11751 | Islip | 270 | 1.9% | 14,790 | 18 |
| 11934 | Center Moriches | 263 | 5.6% | 8,364 | 31 |
| 11726 | Copiague | 261 | 11.5% | 20,763 | 13 |
| 11786 | Shoreham | 255 | 5.4% | 6287 | 41 |
| 11961 | Ridge | 254 | 5.4% | 13,042 | 19 |
| 11769 | Oakdale | 240 | 5.7% | 9,250 | 26 |
| 11579 | Sea Cliff | 239 | 3.0% | 5,037 | 47 |
| 11518 | East Rockaway | 238 | 6.3% | 10,390 | 23 |
| 11553 | Uniondale | 230 | 5.5% | 26,929 | 9 |
| 11950 | Mastic | 229 | 6.0% | 16,233 | 14 |
| 11724 | Cold Spring Harbor | 227 | 3.7% | 3,268 | 69 |
| 11705 | Bayport | 225 | 7.7% | 7,951 | 28 |
| 11798 | Wyandanch | 220 | 10.0% | 17,215 | 13 |
| 11709 | Bayville | 220 | 7.3% | 6,748 | 33 |
| 11976 | Water Mill | 218 | 1.4% | 2,764 | 79 |
| 11971 | Southold | 217 | 6.4% | 6,105 | 36 |
| 11942 | East Quogue | 207 | 10.1% | 5,571 | 37 |
| 11752 | Islip Terrace | 204 | 6.3% | 9,758 | 21 |
| 11713 | Bellport | 203 | 3.6% | 10,970 | 19 |
| 11933 | Calverton | 202 | -1.0% | 6,899 | 29 |
| 11565 | Malverne | 198 | 4.8% | 8,845 | 22 |
| 11558 | Island Park | 174 | 8.1% | 8,954 | 19 |
| 11952 | Mattituck | 174 | 2.4% | 4,701 | 37 |
| 11978 | Westhampton Beach | 174 | 6.7% | 4,087 | 43 |
| 11940 | East Moriches | 163 | 1.2% | 5,396 | 30 |
| 11514 | Carle Place | 162 | 29.6% | 4,635 | 35 |
| 11789 | Sound Beach | 157 | -1.3% | 7,640 | 21 |
| 11575 | Roosevelt | 146 | 6.6% | 18,048 | 8 |
| 11935 | Cutchogue | 146 | -0.7% | 3,432 | 43 |
| 11951 | Mastic Beach | 145 | 2.1% | 13,827 | 10 |
| 11732 | East Norwich | 138 | 7.8% | 3,638 | 38 |
| 11715 | Blue Point | 137 | 1.5% | 4,423 | 31 |
| 11954 | Montauk | 136 | 5.4% | 4,318 | 31 |
| 11930 | Amagansett | 132 | 4.8% | 2,062 | 64 |
| 11509 | East Atlantic Beach | 127 | 10.4% | 2,433 | 52 |
| 11977 | Westhampton | 121 | 9.0% | 2,837 | 43 |
| 11932 | Bridgehampton | 115 | 5.5% | 2,129 | 54 |
| 11944 | Greenport | 112 | 5.7% | 4,801 | 23 |
| 11548 | Greenvale | 112 | 1.8% | 2,313 | 48 |
| 11959 | Quogue | 103 | 2.0% | 1,657 | 62 |
| 11960 | Remsenburg | 99 | -5.7% | 1,688 | 59 |
| 11749 | Islandia | 97 | 4.3% | 3,567 | 27 |
| 11096 | Inwood | 95 | 9.2% | 9,645 | 10 |
| 11941 | Eastport | 93 | -1.1% | 2,605 | 36 |
| 11718 | Brightwaters | 86 | 3.6% | 3,181 | 27 |
| 11964 | Shelter Island | 86 | 0.0% | 2,470 | 35 |
| 11719 | Brookhaven | 81 | -1.2% | 3,447 | 23 |
| 11962 | Sagaponack | 76 | 4.1% | 1,099 | 69 |
| 11975 | Wainscott | 74 | -1.3% | 656 | 113 |
| 11796 | West Sayville | 71 | 4.4% | 3,676 | 19 |
| 11569 | Point Lookout | 67 | 8.1% | 1,527 | 44 |
| 11957 | Orient | 61 | 3.4% | 1,004 | 61 |
| 11948 | Laurel | 54 | -1.8% | 1,212 | 45 |
| 11955 | Moriches | 51 | 15.9% | 3,258 | 16 |
| 11739 | Great River | 51 | -3.8% | 1,385 | 37 |
| 11547 | Glenwood Landing | 46 | 9.5% | 995 | 46 |
| 11965 | Shelter Island Heights | 45 | -4.3% | 766 | 59 |
| 11765 | Mill Neck | 45 | 4.7% | 701 | 64 |
| 11970 | Jamesport (+11947) | 42 | -10.5% | 509 | 83 |
| 11931 | Aquebogue | 40 | 2.6% | 2,500 | 16 |
| 11939 | East Marion | 38 | 11.8% | 1,048 | 36 |
| 11972 | Speonk | 29 | 7.4% | 1,013 | 29 |
| 11958 | Peconic | 26 | 8.3% | 691 | 38 |
| 6390 | Fishers Island | 11 | 0.0% | 422 | 26 |
| 11956 | New Suffolk | 11 | 10.0% | 405 | 27 |
| 11770 | Ocean Beach | 7 | 0.0% | 331 | 21 |